\(n\)が十分大きな値\((n>=30)\)の場合、サイコロを\(n\)個投げて出た目の平均を算出すると、以下の中心極限定理が成り立つ。
出所:統計WEB_中心極限定理
今回は、サイコロを\(n\)個投げて出た目の平均を算出してみたので、そのサンプルプログラムを共有する。なお、サイコロを\(1\)個投げた場合の期待値\(μ\)と分散\(σ^2\)は、以下のように計算される。
\[
\begin{eqnarray}
μ &=& E(X) = 1 \times \displaystyle \frac{1}{6} + 2 \times \displaystyle \frac{1}{6} + \cdots + 6 \times \displaystyle \frac{1}{6} = 3.5 \\
σ^2 &=& V(X) = E(X^2) – \left\{E(X)\right\}^2 \\
&=& 1^2 \times \displaystyle \frac{1}{6} + 2^2 \times \displaystyle \frac{1}{6} + \cdots + 6^2 \times \displaystyle \frac{1}{6} – 3.5^2 = \frac{35}{12}
\end{eqnarray}
\]
サイコロを\(5\)個投げて、出た目の平均を算出するプログラムと実行例は、以下の通り。
import numpy as np

# サイコロをn個投げて、出た目の平均を算出する
# サイコロを1個投げて出た目を、1~6までの乱数を1個生成することで表現
def calc_dice_mean(n):
    dice_trial = list()
    for i in range(0, n):
        dice_trial.append(np.random.randint(1,7,1)[0])
    ret_mean = np.mean(dice_trial)
    print("サイコロの目 : " + str(dice_trial))
    print(f"サイコロを{n}個投げて出た目の平均:{ret_mean}")
    return ret_mean

# 5個のサイコロの目とその平均を算出
calc_dice_mean(5)
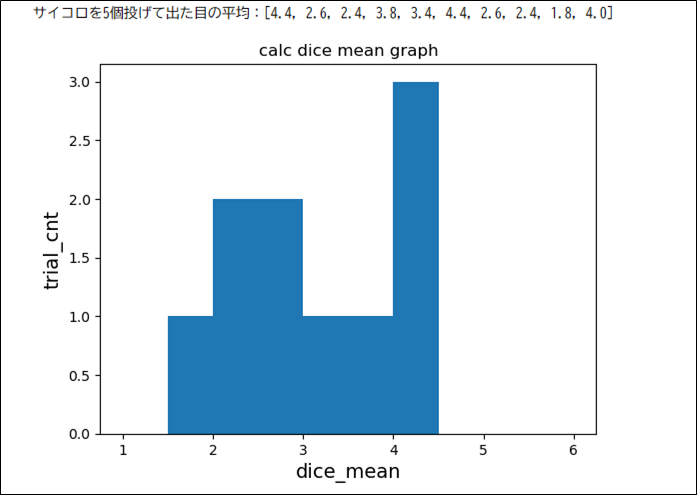
また、\(5\)個のサイコロを投げたときの平均を\(10\)回算出し、それをグラフで描画するプログラムと実行例は、以下の通り。
%matplotlib inline
import numpy as np
import matplotlib.pyplot as plt

# サイコロをn個投げて、出た目の平均を算出する
# サイコロを1個投げて出た目を、1~6までの乱数を1個生成することで表現
def calc_dice_mean(n):
    dice_trial = list()
    for i in range(0, n):
        dice_trial.append(np.random.randint(1,7,1)[0])
    ret_mean = np.mean(dice_trial)
    return ret_mean

# 5個のサイコロを投げたときの平均を10回算出し、それをグラフで描画
dice_cnt = 5
trial_cnt_loop = 10
dice_trial_ave_list = list()
for i in range(0, trial_cnt_loop):
    dice_trial_ave_list.append(calc_dice_mean(dice_cnt))
print(f"サイコロを{dice_cnt}個投げて出た目の平均:" + str(dice_trial_ave_list))

plt.title("calc dice mean graph")
plt.xlabel("dice_mean", size=14)
plt.ylabel("trial_cnt", size=14)
plt.hist(dice_trial_ave_list, range=(1, 6), bins=10)
plt.show()
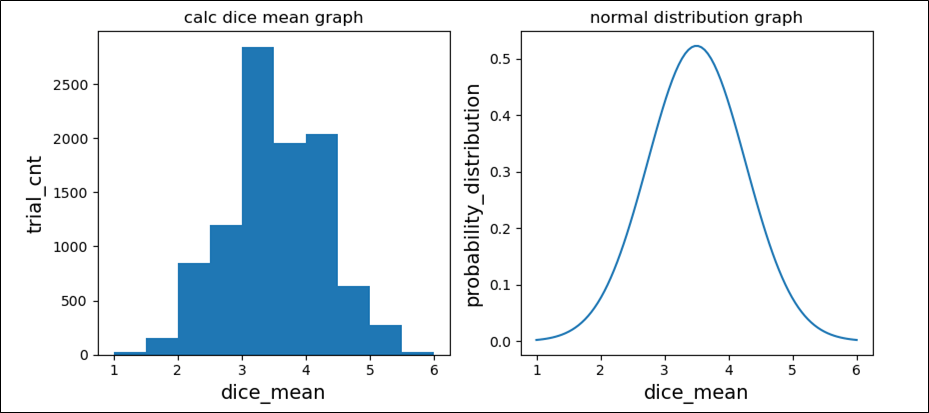
さらに、\(5\)個のサイコロを投げたときの平均を\(10,000\)回算出し、それをグラフで描画し、 平均\(μ\)、分散\(\displaystyle \frac{σ^2}{5}\)である正規分布のグラフと並べて比較してみた結果は以下の通り。
%matplotlib inline
import numpy as np
import matplotlib.pyplot as plt

# サイコロをn個投げて、出た目の平均を算出する
# サイコロを1個投げて出た目を、1~6までの乱数を1個生成することで表現
def calc_dice_mean(n):
    dice_trial = list()
    for i in range(0, n):
        dice_trial.append(np.random.randint(1,7,1)[0])
    ret_mean = np.mean(dice_trial)
    return ret_mean

# 正規分布の計算
# 引数のaveは平均、stdは標準偏差を表す
def normal_distribution(x, ave, std):
    p = np.power(np.e, -((x - ave)** 2) / (2 * (std**2)))
    ret = 1 / (np.sqrt(2 * np.pi) * std) * p
    return ret

# 5個のサイコロを投げたときの平均を10,000回算出し、それをグラフで描画
fig, ax = plt.subplots(1, 2, squeeze=False, figsize=[10,4.2])
dice_cnt = 5
trial_cnt_loop = 10000
dice_trial_ave_list = list()
for i in range(0, trial_cnt_loop):
    dice_trial_ave_list.append(calc_dice_mean(dice_cnt))
ax[0, 0].hist(dice_trial_ave_list, range=(1, 6), bins=10)
ax[0, 0].set_title("calc dice mean graph")
ax[0, 0].set_xlabel("dice_mean", size=14)
ax[0, 0].set_ylabel("trial_cnt", size=14)

# 平均=3.5、標準偏差=((35/12)/5の平方根)である正規分布のグラフを描画
myu = 3.5
sigma = np.sqrt((35/12)/dice_cnt)
x1 = np.linspace(1, 6, 100)
y1_1 = normal_distribution(x1, myu, sigma)
ax[0, 1].plot(x1, y1_1)
ax[0, 1].set_title("normal distribution graph")
ax[0, 1].set_xlabel("dice_mean", size=14)
ax[0, 1].set_ylabel("probability_distribution", size=14)
plt.show()
上記より、\(5\)個のサイコロを投げたときの平均のグラフが、平均\(μ\)、分散\(\displaystyle \frac{σ^2}{5}\)である正規分布のグラフに近づいていることが確認できる。
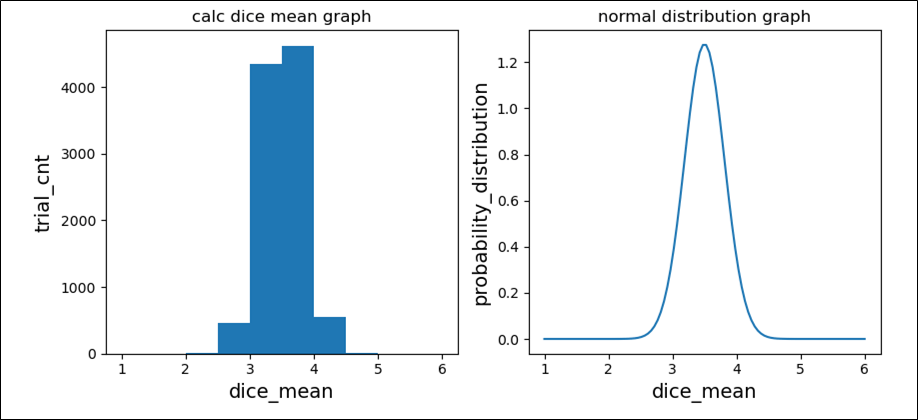
また、\(30\)個のサイコロを投げたときの平均を\(10,000\)回算出し、それをグラフで描画し、 平均\(μ\)、分散\(\displaystyle \frac{σ^2}{30}\)である正規分布のグラフと並べて比較してみた結果は以下の通り。
%matplotlib inline
import numpy as np
import matplotlib.pyplot as plt

# サイコロをn個投げて、出た目の平均を算出する
# サイコロを1個投げて出た目を、1~6までの乱数を1個生成することで表現
def calc_dice_mean(n):
    dice_trial = list()
    for i in range(0, n):
        dice_trial.append(np.random.randint(1,7,1)[0])
    ret_mean = np.mean(dice_trial)
    return ret_mean

# 正規分布の計算
# 引数のaveは平均、stdは標準偏差を表す
def normal_distribution(x, ave, std):
    p = np.power(np.e, -((x - ave)** 2) / (2 * (std**2)))
    ret = 1 / (np.sqrt(2 * np.pi) * std) * p
    return ret

# 30個のサイコロを投げたときの平均を10,000回算出し、それをグラフで描画
fig, ax = plt.subplots(1, 2, squeeze=False, figsize=[10,4.2])
dice_cnt = 30
trial_cnt_loop = 10000
dice_trial_ave_list = list()
for i in range(0, trial_cnt_loop):
    dice_trial_ave_list.append(calc_dice_mean(dice_cnt))
ax[0, 0].hist(dice_trial_ave_list, range=(1, 6), bins=10)
ax[0, 0].set_title("calc dice mean graph")
ax[0, 0].set_xlabel("dice_mean", size=14)
ax[0, 0].set_ylabel("trial_cnt", size=14)

# 平均=3.5、標準偏差=((12/35)/30の平方根)である正規分布のグラフを描画
myu = 3.5
sigma = np.sqrt((12/35)/dice_cnt)
x1 = np.linspace(1, 6, 100)
y1_1 = normal_distribution(x1, myu, sigma)
ax[0, 1].plot(x1, y1_1)
ax[0, 1].set_title("normal distribution graph")
ax[0, 1].set_xlabel("dice_mean", size=14)
ax[0, 1].set_ylabel("probability_distribution", size=14)
plt.show()
上記より、中心極限定理が成立していて、\(5\)個のサイコロを投げた場合と比べ、分散が小さくなっていることが確認できる。
要点まとめ
- 標本を抽出する母集団が平均\(μ\)、分散\(σ^2\)の正規分布に従う場合においても、従わない場合においても、抽出するサンプルサイズ\(n\)が大きくなるについて標本平均の分布は「平均\(μ\)、分散\(σ^2/n\)」の正規分布\(N(μ, σ^2/n)\)に近づくという定理を、中心極限定理という。


