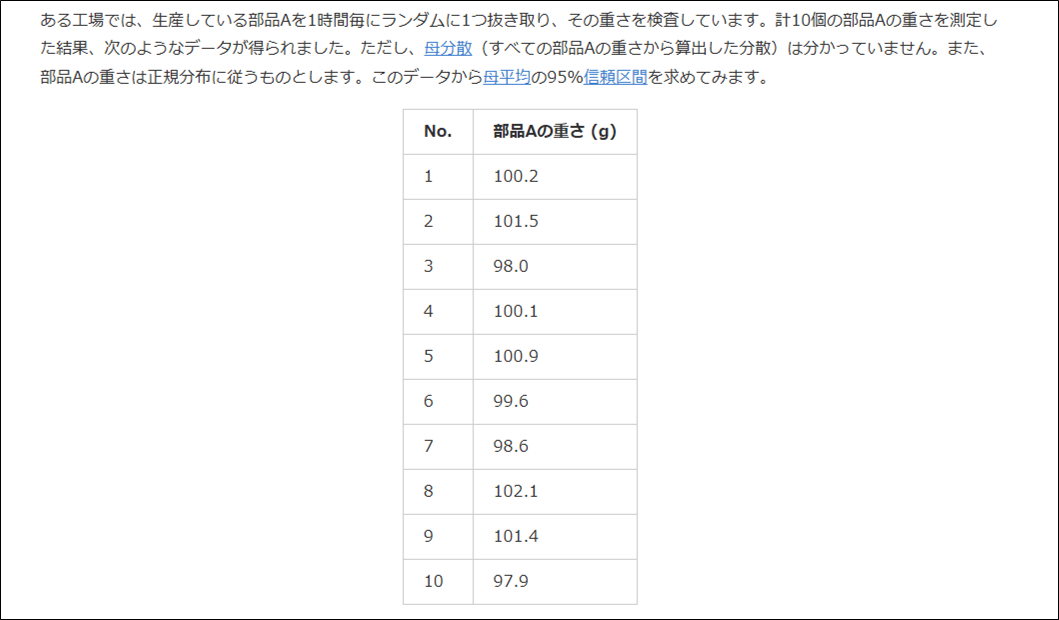
以下の条件を満たす、母平均の\(95\)%信頼区間を考える。
この問題を考えるにあたって、以下の性質を利用する。
- 確率変数\(X_1,X_2,\cdots,X_n\)は互いに独立で、平均\(μ\),分散\(σ^2\)の分布に従うとすると、標本平均\(\bar{X}=\displaystyle \frac{1}{n} \sum_{i=1}^{n}X_i\)について\(E(\bar{X})=μ\),\(V(\bar{X})=\displaystyle \frac{σ^2}{n}\)である。
- \(\displaystyle \frac{\bar{X}-μ}{\sqrt{\displaystyle \frac{σ^2}{n}}}~N(0,1)\)のとき、\(σ^2\)を標本不偏分散である\(U^2=\displaystyle \frac{1}{n-1}\sum_{i=1}^{n} \left(X_i – \bar{X} \right)^2\)に取り替えた統計量は、自由度\(n-1\)の\(t\)分布と呼ばれる分布に従うことが知られている。
これを式で表すと、\(\displaystyle \frac{\bar{X}-μ}{\sqrt{\displaystyle \frac{U^2}{n}}}~t(n-1)\)となる。
利用する性質①「確率変数\(X_1,X_2,\cdots,X_n\)は互いに独立で、平均\(μ\),分散\(σ^2\)の分布に従うとすると、標本平均\(\bar{X}=\displaystyle \frac{1}{n} \sum_{i=1}^{n}X_i\)について\(E(\bar{X})=μ\),\(V(\bar{X})=\displaystyle \frac{σ^2}{n}\)である。」を示す方法は、以下の記事を参照のこと。

また、利用する性質②に記載の\(t\)分布については、後述する。
\(t\)分布とグラフ
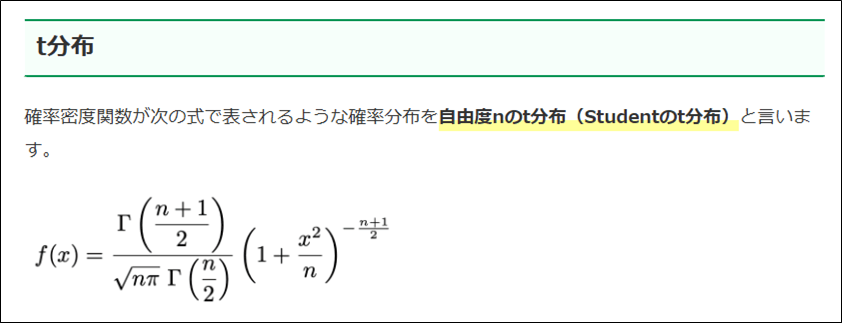
\(t\)分布の確率密度関数は以下の通りで、自由度\(n\)を決めることで確率分布関数が決まるようになっている。
出所:とけたろう_t分布の式
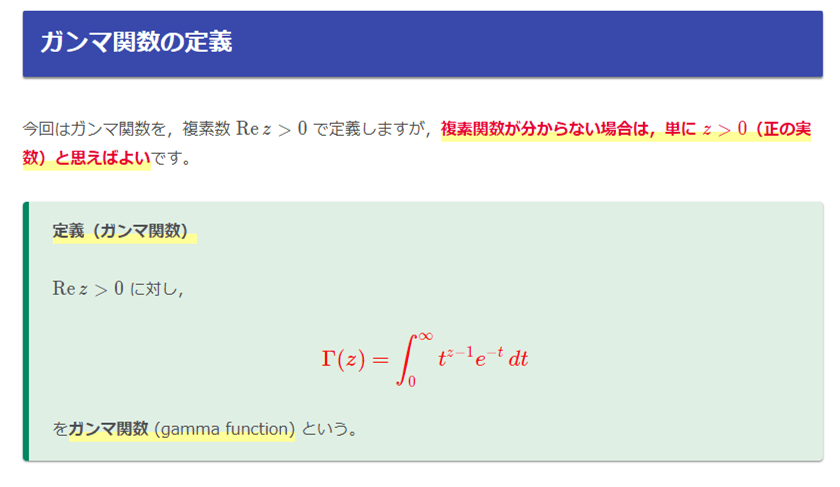
また、上記\(t\)分布の確率密度関数で利用している\(Γ(s)\)はガンマ関数で、以下の式で定義される。
上記\(t\)分布の確率密度関数の式は煩雑であるが、\(t\)分布のグラフは、Scipyのstats.t.pdf関数を利用して描くことができる。例えば、自由度\(n=9\)の場合、\(t\)分布のグラフを描画した結果は、以下の通り。
%matplotlib inline
import numpy as np
import matplotlib.pyplot as plt
from scipy import stats

# -5~5までを100等分した値をxとする
x = np.linspace(-5, 5, 100)
# 自由度nの値を定義
n = 9

# 自由度nのt分布の値を計算し、グラフに描画
y = stats.t(n).pdf(x)
plt.plot(x, y)
plt.title(f"t distribution graph(freedom {n})")
plt.xlabel("x", size=14)
plt.ylabel("y", size=14)
plt.grid()
plt.show()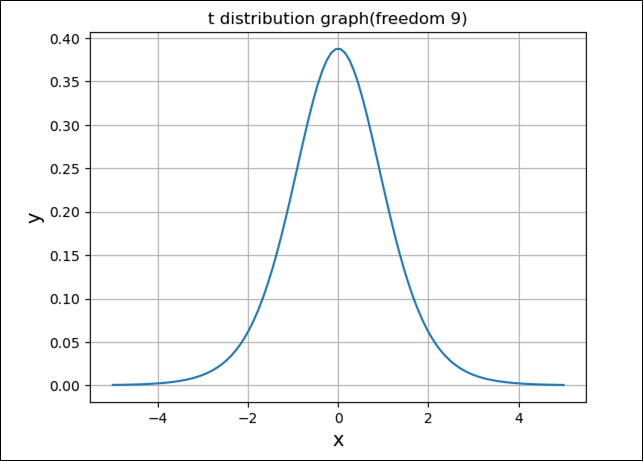
また、\(t\)分布のグラフは、自由度\(n\)が大きくなるにつれて、正規分布のグラフに近づいていく。例えば、\(n=1,2,9\)の\(t\)分布と、正規分布のグラフを描画した結果は、以下の通り。
%matplotlib inline
import numpy as np
import matplotlib.pyplot as plt
from scipy import stats

# -5~5までを100等分した値をxとする
x = np.linspace(-5, 5, 100)
# 自由度の値を定義
n_1 = 1
n_2 = 2
n_3 = 9

# 各自由度のt分布の値を計算し、グラフに描画
y_1 = stats.t(n_1).pdf(x)
y_2 = stats.t(n_2).pdf(x)
y_3 = stats.t(n_3).pdf(x)
y_4 = stats.norm.pdf(x)
plt.plot(x, y_1, label=f"t dist(freedom {n_1})")
plt.plot(x, y_2, label=f"t dist(freedom {n_2})")
plt.plot(x, y_3, label=f"t dist(freedom {n_3})")
plt.plot(x, y_4, label=f"normal dist", color="black")
plt.title(f"t and normal distribution graph")
plt.xlabel("x", size=14)
plt.ylabel("y", size=14)
plt.legend()
plt.grid()
plt.show()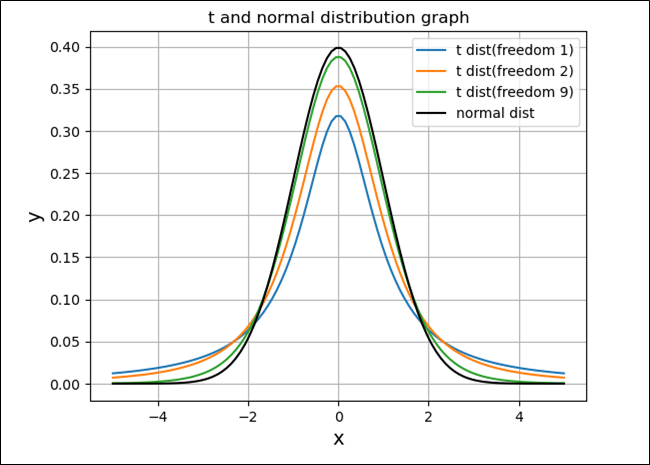

母平均の\(95\)%信頼区間の手動計算
この記事の冒頭に記載した例題の、母平均の\(95\)%信頼区間を計算した結果は、以下の通り。
\[
\begin{eqnarray}
\bar{X} &=& \displaystyle \frac{1}{n}\sum_{i=1}^{n}X_i = \frac{1}{10}\sum_{i=1}^{10}X_i \\
&=& \frac{1}{10}(100.2 + 101.5 + 98.0 + 100.1 + 100.9 + 99.6 + 98.6 + 102.1 + 101.4 + 97.7) \\
&=& \displaystyle \frac{1}{10} \times 1000.3 = 100.03 \\
U^2 &=& \displaystyle \frac{1}{n-1}\sum_{i=1}^{n}\left(X_i – \bar{X} \right)^2 = \frac{1}{10-1}\sum_{i=1}^{10}\left(X_i – \bar{X} \right)^2 \\
&=& \frac{1}{9} \{\left(100.2 – 100.03 \right)^2 + \left(101.5 – 100.03 \right)^2 + \cdots + \left(98.0 – 100.03 \right)^2 )\} \\
&=& \frac{1}{9} \times 20.001 ≒ 2.222 \\
\displaystyle \frac{U^2}{n} &≒& 2.222 / 10 = 0.222
\end{eqnarray}
\]
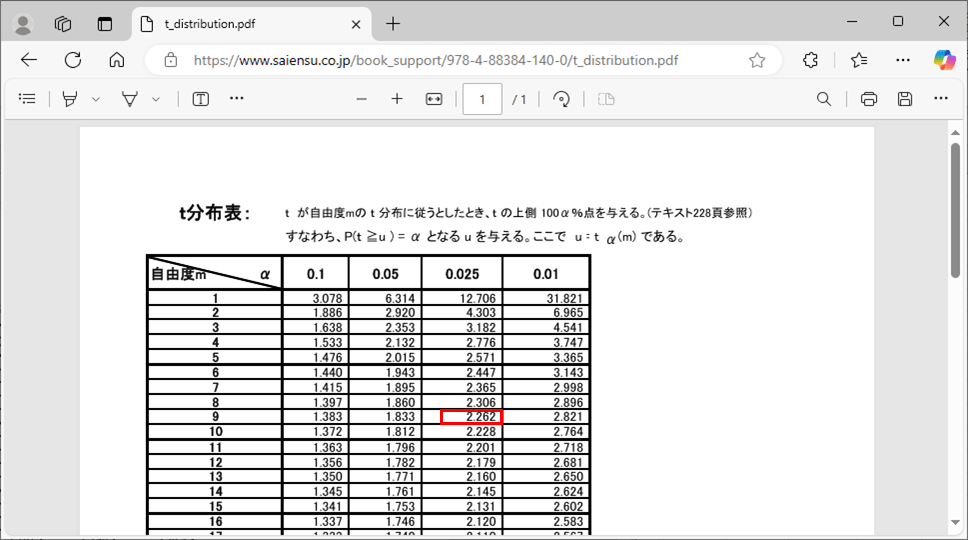
また、この計算を進めるにあたり、以下のt分布表を利用する。
出所:t分布表
\(\displaystyle \frac{\bar{X} – μ}{\sqrt{\displaystyle\frac{U^2}{n}}}\)が自由度\(n-1(=9)\)の\(t\)分布において\(95\)%の範囲内に収まるようにするには、
上記\(t\)分布表より、\(-2.262 ≦ \displaystyle \frac{\bar{X} – μ}{\sqrt{\displaystyle\frac{U^2}{n}}} ≦ 2.262\)となればよいので、
\(\bar{X}=100.03\)、\(\displaystyle \frac{U^2}{n}≒0.222\)を代入し計算すると、以下のようになる。
\[
\begin{eqnarray}
-2.262 &≦& \displaystyle \frac{100.03 – μ}{\sqrt{0.222}} ≦ 2.262 \\
-2.262 \times \sqrt{0.222} &≦& 100.03 – μ ≦ 2.262 \times \sqrt{0.222} \\
-2.262 \times \sqrt{0.222} – 100.03 &≦& -μ ≦ 2.262 \times \sqrt{0.222} – 100.03 \\
2.262 \times \sqrt{0.222} + 100.03 &≧& μ ≧ -2.262 \times \sqrt{0.222} + 100.03 \\
-2.262 \times \sqrt{0.222} + 100.03 &≦& μ ≦ 2.262 \times \sqrt{0.222} + 100.03 \\
-1.06578・・・+100.03 &≦& μ ≦ 1.06578・・・+100.03
\end{eqnarray}
\]
上記計算を行い小数第三位を四捨五入すると、\(98.96 ≦ μ ≦ 101.10\)となる。
母平均の\(95\)%信頼区間のプログラムによる計算
この記事の冒頭に記載した例題の、母平均の\(95\)%信頼区間を計算した結果をプログラムで計算した結果は、以下の通り。
import numpy as np
from scipy import stats

# 計10個の部品Aの重さのデータ(標本)とそのデータ数を表示
parts_a_list = [100.2, 101.5, 98.0, 100.1, 100.9, 99.6, 98.6, 102.1, 101.4, 97.9]
parts_a_list_cnt = len(parts_a_list)
print("*** 計10個の部品Aの重さのデータとそのデータ数 ***")
print("計10個の部品Aの重さのデータ(標本):", parts_a_list)
print(f"計10個の部品Aの重さのデータ(標本)のデータ数:{parts_a_list_cnt}")
print()

# 計10個の部品Aの重さのデータから、標本平均・不偏分散・標本平均の分散を算出
parts_a_list_mean = np.mean(parts_a_list)
parts_a_list_var = np.var(parts_a_list, ddof=1)
parts_a_list_mean_var = parts_a_list_var / parts_a_list_cnt
print("*** 計10個の部品Aの重さの標本平均と不偏分散と標本平均の分散 ***")
print(f"標本平均:{parts_a_list_mean}")
print(f"不偏分散:{parts_a_list_var}")
print(f"標本平均の分散:{parts_a_list_mean_var}")
print()

# t分布の自由度を算出
degree_of_freedom = parts_a_list_cnt - 1
print("*** t分布の自由度 ***")
print(degree_of_freedom)
print()

# 算出した自由度のt分布に従う95%信頼区間の母平均の下限値と上限値を求める
# confidence:信頼係数、df:自由度、loc:標本平均、scale:標本の標準偏差
low, up = stats.t.interval(confidence=0.95, df=degree_of_freedom
                           , loc=parts_a_list_mean, scale=np.sqrt(parts_a_list_mean_var))
print(f"*** 自由度{degree_of_freedom}のt分布に従う95%信頼区間の母平均の下限値~上限値 ***")
print(f"下限値:{low}~上限値:{up}")
要点まとめ
- 確率変数\(X_1,X_2,\cdots,X_n\)は互いに独立で、平均\(μ\),分散\(σ^2\)の分布に従うとすると、標本平均\(\bar{X}=\displaystyle \frac{1}{n} \sum_{i=1}^{n}X_i\)について\(E(\bar{X})=μ\),\(V(\bar{X})=\displaystyle \frac{σ^2}{n}\)である。
- \(\displaystyle \frac{\bar{X}-μ}{\sqrt{\displaystyle \frac{σ^2}{n}}}~N(0,1)\)のとき、\(σ^2\)を標本不偏分散である\(U^2=\displaystyle \frac{1}{n-1}\sum_{i=1}^{n} \left(X_i – \bar{X} \right)^2\)に取り替えた統計量は、自由度\(n-1\)の\(t\)分布と呼ばれる分布に従うことが知られている。
これを式で表すと、\(\displaystyle \frac{\bar{X}-μ}{\sqrt{\displaystyle \frac{U^2}{n}}}~t(n-1)\)となる。 - 母分散が未知の場合、母平均の\(95\)%信頼区間を計算するには、自由度\(n-1\)の\(t\)分布の上側\(0.25\)である値\(α\)を読み取り、\(\displaystyle \frac{\bar{X}-μ}{\sqrt{\displaystyle \frac{U^2}{n}}}\)が\(-α\)以上\(α\)以下の範囲に収まる\(μ\)を計算すればよい。
