正規分布は連続型の確率分布(=確率密度関数)の1つで、世の中の多くの分布が正規分布に従うといわれている。
平均\(μ\)、分散\(σ^2\)の正規分布に従う確率変数\(X\)の確率密度関数\(f(x)\)は、以下の式で表せる。
出所:統計WEB_正規分布
例えば、平均\(μ=0\)、分散\(σ^2=1\)の正規分布(=標準正規分布)のグラフを描いた場合の、ソースコードと実行結果は、以下のようになる。
%matplotlib inline
import numpy as np
import matplotlib.pyplot as plt

# 正規分布の計算
# 引数のaveは平均、stdは標準偏差を表す
def normal_distribution(x, ave, std):
    p = np.power(np.e, -((x - ave)** 2) / (2 * (std**2)))
    ret = 1 / (np.sqrt(2 * np.pi) * std) * p
    return ret

# -5~5までを100等分した値をxとする
x = np.linspace(-5, 5, 100)
# 平均=0, 標準偏差=1の場合のグラフを描画
y = normal_distribution(x, 0, 1)
plt.plot(x, y)
plt.title("normal distribution graph")
plt.xlabel("x", size=14)
plt.ylabel("y", size=14)
plt.grid()
plt.show()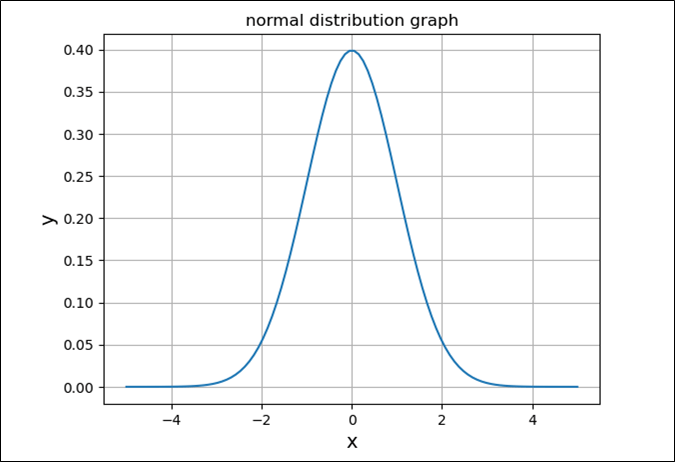
また、平均または標準偏差を変更しながら、正規分布のグラフを描いた場合の、ソースコードと実行結果は、以下のようになる。
%matplotlib inline
import numpy as np
import matplotlib.pyplot as plt

# 正規分布の計算
# 引数のaveは平均、stdは標準偏差を表す
def normal_distribution(x, ave, std):
    p = np.power(np.e, -((x - ave)** 2) / (2 * (std**2)))
    ret = 1 / (np.sqrt(2 * np.pi) * std) * p
    return ret

# 標準偏差を固定し、平均を移動させた場合のグラフ
# ①平均=-1, 標準偏差=1の場合
# ②平均=0, 標準偏差=1の場合
# ③平均=1, 標準偏差=1の場合 それぞれのグラフを描画
x1 = np.linspace(-5, 5, 100)
y1_1 = normal_distribution(x1, -1, 1)
y1_2 = normal_distribution(x1, 0, 1)
y1_3 = normal_distribution(x1, 1, 1)
plt.plot(x1, y1_1, label="ave=-1, std=1")
plt.plot(x1, y1_2, label="ave=0, std=1")
plt.plot(x1, y1_3, label="ave=1, std=1")
plt.title("normal distribution graph")
plt.xlabel("x1", size=14)
plt.ylabel("y1", size=14)
plt.legend()
plt.grid()
plt.show()

# 平均を固定し、標準偏差を移動させた場合のグラフ
# ①平均=0, 標準偏差=0.5の場合
# ②平均=0, 標準偏差=1の場合
# ③平均=0, 標準偏差=2の場合 それぞれのグラフを描画
x2 = np.linspace(-5, 5, 100)
y2_1 = normal_distribution(x2, 0, 0.5)
y2_2 = normal_distribution(x2, 0, 1)
y2_3 = normal_distribution(x2, 0, 2)
plt.plot(x2, y2_1, label="ave=0, std=0.5")
plt.plot(x2, y2_2, label="ave=0, std=1")
plt.plot(x2, y2_3, label="ave=0, std=2")
plt.title("normal distribution graph")
plt.xlabel("x2", size=14)
plt.ylabel("y2", size=14)
plt.legend()
plt.grid()
plt.show()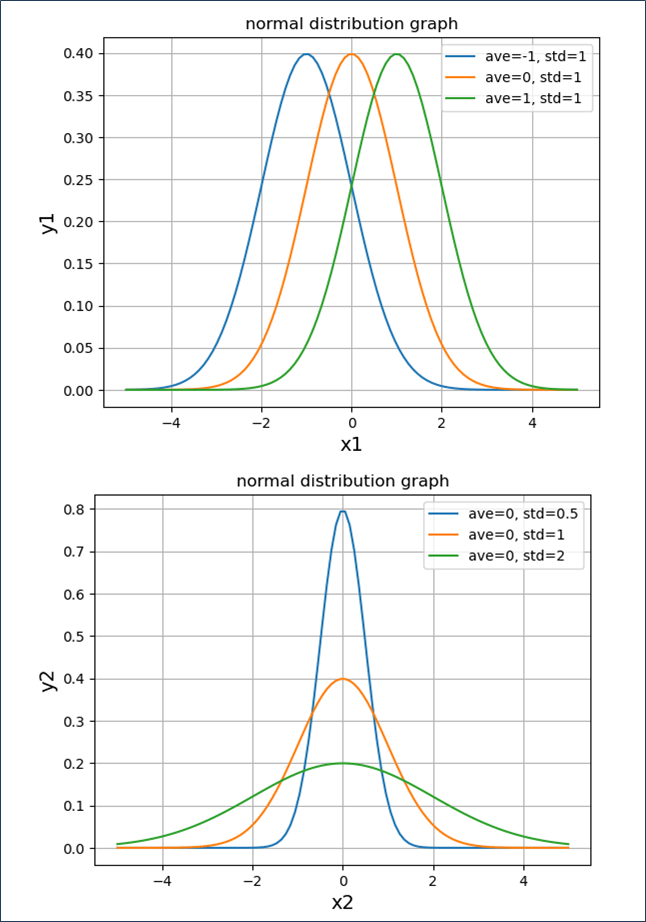

さらに、平均\(μ=0\)、分散\(σ^2=1\)の正規分布(=標準正規分布)のグラフに、\(-σ\)~\(+σ\)の範囲(全体の約\(68.3\)%)を色付けすると、以下のようになる。
%matplotlib inline
import numpy as np
import matplotlib.pyplot as plt

# 正規分布の計算
# 引数のaveは平均、stdは標準偏差を表す
def normal_distribution(x, ave, std):
    p = np.power(np.e, -((x - ave)** 2) / (2 * (std**2)))
    ret = 1 / (np.sqrt(2 * np.pi) * std) * p
    return ret

# -5~5までを100等分した値をxとする
x = np.linspace(-5, 5, 100)
# 平均=0, 標準偏差=1の場合のグラフを描画
y = normal_distribution(x, 0, 1)
plt.plot(x, y)
plt.title("normal distribution graph")
plt.xlabel("x", size=14)
plt.ylabel("y", size=14)

# x=-1(-std), x=1(std)のグラフを点線で表示
plt.axvline(x=-1, linestyle="dashed")
plt.axvline(x=1, linestyle="dashed")
plt.xticks([-4,-2,-1,0,1,2,4])

# x=-1~1までの範囲を塗りつぶし、グラフに描画
x1 = np.linspace(-1, 1, 100)
y1 = normal_distribution(x1, 0, 1)
plt.fill_between(x1, y1, fc="lightblue")
plt.grid()
plt.show()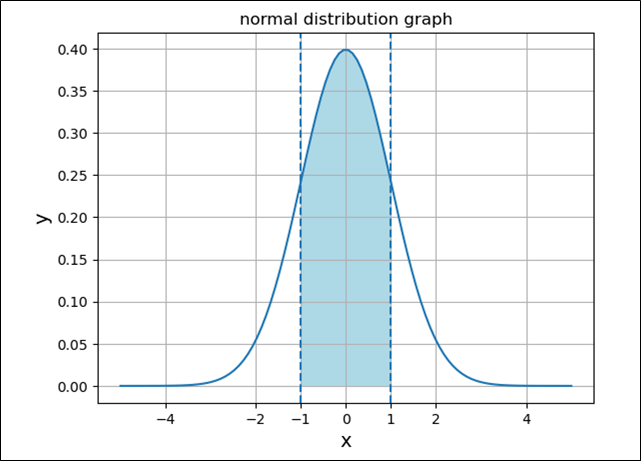
また、平均\(μ=0\)、分散\(σ^2=1\)の正規分布(=標準正規分布)のグラフに、\(-2σ\)~\(+2σ\)の範囲(全体の約\(95.4\)%)を色付けすると、以下のようになる。
%matplotlib inline
import numpy as np
import matplotlib.pyplot as plt

# 正規分布の計算
# 引数のaveは平均、stdは標準偏差を表す
def normal_distribution(x, ave, std):
    p = np.power(np.e, -((x - ave)** 2) / (2 * (std**2)))
    ret = 1 / (np.sqrt(2 * np.pi) * std) * p
    return ret

# -5~5までを100等分した値をxとする
x = np.linspace(-5, 5, 100)
# 平均=0, 標準偏差=1の場合のグラフを描画
y = normal_distribution(x, 0, 1)
plt.plot(x, y)
plt.title("normal distribution graph")
plt.xlabel("x", size=14)
plt.ylabel("y", size=14)

# x=-2(-2*std), x=2(2*std)のグラフを点線で表示
plt.axvline(x=-2, linestyle="dashed")
plt.axvline(x=2, linestyle="dashed")

# x=-2~2までの範囲を塗りつぶし、グラフに描画
x1 = np.linspace(-2, 2, 100)
y1 = normal_distribution(x1, 0, 1)
plt.fill_between(x1, y1, fc="lightblue")
plt.grid()
plt.show()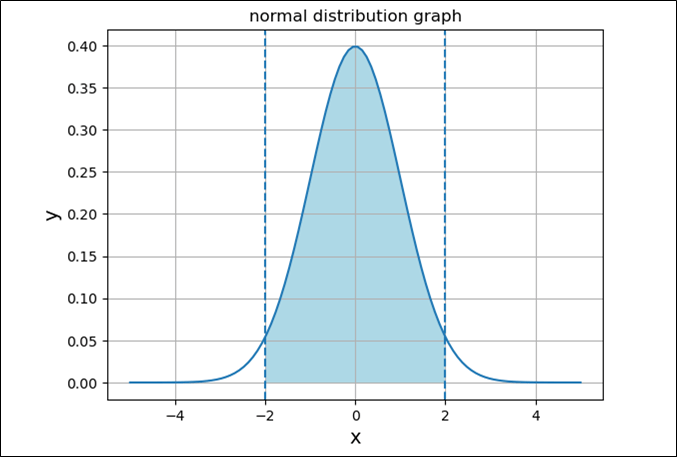
ちなみに、上記で色づけした部分の面積の割合は、以下のサイトのような、標準正規分布表から確認できる。
https://www.coronasha.co.jp/np/data/docs1/978-4-339-06128-4_2.pdf
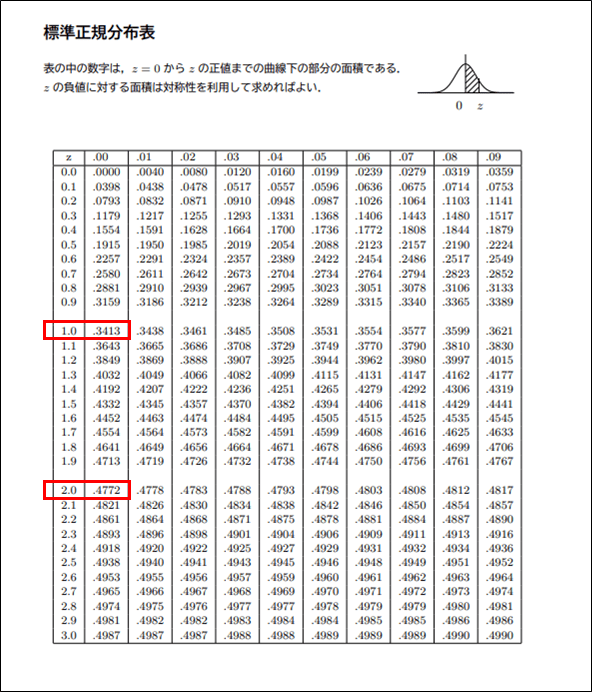
上記の標準正規分布表より、\(-σ\)~\(+σ\)の範囲となる確率は、\(z=1.0\)の場合の面積が\(0.3413\)なので、\(0.3413 \times 2\ = 0.6826 ≒ 0.683 = 68.3%\)となり、\(-2σ\)~\(+2σ\)の範囲となる確率は、\(z=2.0\)の場合の面積が\(0.4772\)なので、\(0.4772 \times 2\ = 0.9544 ≒ 0.954 = 95.4%\)となる。
ちなみに、この性質は、平均や分散・標準偏差の値とは関係なく、全ての正規分布のグラフに当てはまる。
要点まとめ
- 正規分布は連続型の確率分布(=確率密度関数)の1つで、世の中の多くの分布が正規分布に従うといわれている。
- 平均\(μ\)、分散\(σ^2\)の正規分布に従う確率変数\(X\)の確率密度関数\(f(x)\)は、以下の式で表せる。
\[
f(x)=\frac{1}{\sqrt{2π}σ}e^{-\frac{{(x-μ)}^2}{2σ^2}} (-\infty \lt x \lt \infty)
\] - 平均\(μ=0\)、分散\(σ^2\)の正規分布では、\(-σ\)~\(+σ\)の範囲に全体の約\(68.3\)%のデータが、
\(-2σ\)~\(+2σ\)の範囲に全体の約\(95.4\)%のデータが、それぞれ当てはまる。


